
A number in an L&D deck has usually passed through several pairs of hands before it reaches you. The deck quotes a blog, the blog quotes a report, and the report quotes an industry survey. Somewhere along the way the sample size, the date, and the thing that was actually measured all drop off.
We traced 130+ primary sources while writing The Neurogogy Handbook. Several of the industry’s best-known figures did not survive the journey (we’ve covered some of these in 15 Learning Myths Busted). This is the other half of that work: 30 numbers that held up.
Between them they tell you where to spend, what to stop paying for, and which arguments you can win.
Each one is stated in plain terms first, then shown with its sample and its limits, so you can put it in a deck and defend it. All thirty come from primary research rather than industry surveys. Where the real figure is smaller than the one in circulation, we say so.
That’s right, we’re bringing the receipts.
How to Read a Number in This List
One detour first. Researchers measure how much difference something made using letters. Mostly d, sometimes g, and the occasional ρ for variety. Nobody has ever been thrilled to meet them. However, 90 seconds here saves a lifetime of nodding at numbers you can’t read.
- Effect Size: One number for how much difference something made, on a scale that lets you compare different studies. Written d or g. Roughly: 0.2 is small, 0.5 is moderate, and 0.8 is large. We’ll state effect sizes in clear terms throughout.
- Standard Deviation: The unit effect sizes are counted in. One standard deviation moves the average person from the middle of a group to roughly the top 16%.
- Meta-analysis: A study of studies, pooling every experiment already run on a question. Pooled figures are almost always smaller than the single study that made a technique famous, and almost always more reliable.
- Publication Bias: Studies that find something get published. Studies that find nothing often do not. So the published literature often overstates things. Several numbers below may be smaller than you’ve heard.
Part One: What Learners Can Process

1. Working memory holds 4 items, not 7
Working memory holds a range of 3 to 5 items, and it counts chunks rather than facts. Miller’s “seven plus or minus two” was a number he himself called “a pernicious, Pythagorean coincidence”. Four is what survives once rehearsal and long-term support are stripped out.
→ Source: Miller, 1956, Cowan, 2001
→ Read more: Cognitive Load Theory
2. Worked examples put novices ahead of 69% of learners
Give a beginner a finished example instead of a problem to solve and they outperform about 69% of their peers left to work it out alone. However, if you do the same for someone who already knows the subject, the effect reverses (+0.51 for novices and -0.43 for experts, across 5,924 learners).
→ Source: Tetzlaff et al., 2025
→ Read more: Desirable Difficulties
3. Your decorative photo costs about 6 percentile points
Add an interesting-but-irrelevant photo and the average learner slips from the middle of the group to roughly the 44th percentile. The effect on learning outcomes was -0.16 across 50 studies. That’s a small effect, but a notable one. It works by adding cognitive load rather than pulling attention away.
→ Source: Cheng et al., 2026
→ Read more: Seductive Details
4. Adding pictures to words moved learners up 42 percentile points
Presenting the same idea in words and images beat words alone in all eleven controlled comparisons, at an effect of 1.39 on learning outcomes. That takes the average learner from the middle of the group to roughly the 92nd percentile. Note: these experiments were conducted in Mayer’s own laboratory, so read it as a strong direction rather than a precise size.
→ Source: Mayer, Multimedia Learning, ch. 4
→ Read more: Dual Coding
5. Average time on a screen before switching has fallen to 47 seconds
Measured across two decades of screen-tracking studies at UC Irvine. This is a constraint on the environment your content lands in, rather than a diagnosis of your learners’ attention spans. It’s a challenge your learning technology should acknowledge.
→ Source: Mark, 2023
→ Read more: Microlearning
Part Two: What Makes Learning Stick

6. Learners recalled 80% after testing themselves, 36% after re-reading
A week after studying Swahili-English pairs on computerised flashcards, the group who practised retrieving them recalled around 80%. The group who restudied the material recalled just 36%. Same material, same time on task, different retention.
→ Source: Karpicke & Roediger, 2008
→ Read more: Retrieval Practice
7. Interleaved practice: 74% recall against 42% after 30 days
126 seventh-graders practised maths problems either shuffled or in blocks. A day later the gap was 80% (shuffled) against 64% (blocked). At 30 days it had widened to 74% against 42%. A later randomised trial across 787 students found an effect of 0.83 on test scores, putting the average interleaved learner ahead of 80% of the blocked group.
→ Source: Rohrer et al., 2015, Rohrer et al., 2020
→ Read more: Interleaving
8. Spaced practice lifts learners past 78% of those who crammed
Spread the same material over time rather than massing it and the average learner ends up ahead of about 78% of those who took it in one go. The effect on knowledge outcomes was 0.78 (a large effect) across 21,415 learners in 14 studies.
→ Source: Maye & Hurley, 2026
→ Read more: Spaced Repetition
9. Producing an answer beats reading one: 0.40 on recall across 86 studies
Drawn from 445 effect sizes, that puts the average learner who generated the answer ahead of roughly 66% of those handed it. Asking learners to explain their own reasoning does better still, at 0.55 on learning outcomes across 64 reports, which puts them ahead of about 71% of those who don’t.
→ Source: Bertsch et al., 2007, Bisra et al., 2018
→ Read more: Elaboration and the Generation Effect
10. Feedback made performance worse in more than 38% of cases
Pooled across 131 studies and 12,652 people, feedback lifted performance by 0.41 on average, putting the person who received it ahead of about 66% of those who got none. However, more than a third of the time it did the opposite. The detail contained in the feedback is the differentiator.
→ Source: Kluger & DeNisi, 1996, Butler, Karpicke & Roediger, 2008
→ Read more: Constructive Feedback
Part Three: The Optimum Learning Conditions

11. One night without sleep cost 19% on a memory test two days later
14 people were kept awake the night before learning, while 14 slept normally. Both groups then slept normally for two nights before being tested. The deprived group recognised 19% less. Sleep before learning matters as much as sleep after it.
→ Source: Yoo et al., 2007
→ Read more: The Neuroscience of Sleep and Learning
12. Sleep made solving a hidden problem more than twice as likely
Participants were given a number task with a shortcut nobody told them about. Those who slept between sessions spotted it more than twice as often as those who stayed awake. Time of day was ruled out as an explanation.
→ Source: Wagner et al., 2004
→ Read more: The Neuroscience of Memory
13. Neutral material faded more than 2x as fast as emotional material
Recollection was tested at 15 minutes, one week, and two weeks across 48 students. Neutral material fell 41%, emotional material 19%. The gap only became significant at the longest delay. Emotion changes what survives, not what goes in.
→ Source: Anderson et al., 2006
→ Read more: Emotional Engagement in Learning
14. Boredom explains about 3.6% of the difference in attainment
Across 147 studies and 131,446 students, the correlation between boredom and achievement was -0.19, which accounts for roughly 3.6% of the variation between learners. Boredom is real and worth fixing, but it’s not as big an issue as you might think.
→ Source: Shui & Zhu, 2026
→ Read more: Engaging the Modern Learner
15. A single 25mg dose of cortisone wiped out recall of a list learned the day before
36 adults learned 60 words, then took cortisone or a placebo before being tested 24 hours later. Recall was impaired. Give cortisone before learning instead and nothing happens. Stress damages getting things out, not putting them in.
→ Source: de Quervain et al., 2000
→ Read more: Taming Cortisol
Part Four: What Survives Contact With the Job

16. Training moves knowledge 4x more than it moves behaviour
Behaviour modelling (watching a skill demonstrated, practising it, getting feedback) produced about a full standard deviation of change in knowledge and skills, putting the average trained person ahead of roughly 84% of the untrained. However, measure what they actually did back at work and it drops to about a quarter of that.
→ Source: Taylor, Russ-Eft & Chan, 2005
→ Read more: Social Learning Theory
17. No single predictor explains more than 14% of whether training transfers
Pooled across 89 studies and 12,496 people, the single biggest predictor of transfer was the learner’s cognitive ability at 0.37. Then:
- Voluntary participation at 0.34
- Supervisor support at 0.31
- Conscientiousness at 0.28
- Transfer climate at 0.27
Square the strongest of those and you get 14%, the share of the variation in transfer that cognitive ability accounts for. In other words, there is no single lever, only a set of small additive ones.
→ Source: Blume et al., 2010
→ Read more: Learning Transfer
18. Teaching learners how to learn adds eight months of progress
Metacognition and self-regulation (getting learners to plan, monitor, and evaluate their own learning) is rated as adding eight months of additional progress across 355 studies, at very low cost. The evidence base is school-age pupils, so treat the size as a strong direction rather than a workplace figure.
→ Source: Education Endowment Foundation
→ Read more: Metacognition
19. Rewards moved motivation down 13 percentile points
Across 128 studies, tangible rewards reduced intrinsic motivation by 0.34, taking the average person from the middle of the group to roughly the 37th percentile. Verbal praise moved it the other way by 0.33. The mechanism is that a reward reframes the task as something you would not otherwise choose to do.
→ Source: Deci, Koestner & Ryan, 1999
→ Read more: Intrinsic Motivation
20. Gamification lifts learners past 78% of their peers
Gamification had an effect of 0.78 on academic performance, pooled across 22 experimental studies run between 2008 and 2023. That is a large effect by the usual conventions. Note: many of these meta-analyses vary on what counts as gamification, so treat this as a strong signal rather than a settled figure.
→ Source: Zeng, Sun & Looi, 2024
→ Read more: Gamification in Learning
Part Five: What Feels Like Learning But Isn’t

21. How much learners like your training explains under 1% of whether they learned
Reaction measures correlate with learning at 0.08, which accounts for well under 1% of the difference between learners. The one reaction question carrying a real signal is whether they found it useful, at 0.26. Your happy sheet may be measuring the wrong thing.
→ Source: Alliger et al., 1997
→ Read more: Training Evaluation
22. 72% of learners think cramming works better than spacing
Learners studied flashcards either spread out or massed together. Spacing produced better recall for 90% of them. Asked afterwards which method had worked better, 72% said cramming. The technique that works and the technique that feels like it’s working are not the same one.
→ Source: Kornell, 2009
→ Read more: 15 Learning Myths Busted
23. Students using AI practised 48% better, then scored 17% worse
A field experiment in Turkish schools gave around 1,000 students GPT-4 during maths practice. While they had it, performance rose 48%. When it was taken away for an unassisted exam, the same students scored 17% below those who never had access. The gains were real, but they belonged to the tool, not the learner.
→ Source: Bastani et al., 2024
→ Read more: AI in Learning
24. 89.1% of educators believe learners have a learning style
Pooled across 37 studies and 15,405 educators in 18 countries. When researchers tested stated preference against measured performance in each modality, they found no relationship between the two. The belief is close to universal and yet the evidence for acting on it is absent.
→ Source: Newton & Salvi, 2020
→ Read more: Learning Styles
25. People scoring in the bottom 12% rate themselves at the 62nd percentile
On a test of logical reasoning, the lowest-scoring group placed at the 12th percentile and put their own ability at the 62nd. The gap narrows as competence rises, because judging your own performance draws on the same skill as performing well.
→ Source: Kruger & Dunning, 1999
→ Read more: Understanding Modern Learners
Part Six: Cite These Instead

26. The 10% transfer figure came from one unnamed person in 1982
It traces to a single article in the Training and Development Journal, where it appears as an off-the-cuff estimate. No study, no method, no data. Cite entry 17 instead: transfer has no single lever, and the strongest predictor of it accounts for about 14% of why some training sticks and some doesn’t.
→ Source: Georgenson, 1982
→ Read more: The Kirkpatrick Model
27. Ebbinghaus did not prove we forget 90% of all learning in a week
The 2015 replication of his data puts savings at 21.1% after a month, and the one-day figure at 33.7% rather than the collapse the popular curve shows. Keep in mind Ebbinghaus only tested one subject (himself) and tracked savings on relearning rather than recall.
→ Source: Murre & Dros, 2015
→ Read more: The Forgetting Curve
28. The 66-day habit figure is not reliable
96 volunteers recruited, 82 analysed, median time to automaticity 66 days. Other studies cite other numbers or ranges. Typically, the length of time taken to form a habit depends on the complexity of the task at hand. After all, it’s easier to remember to wash your hands than it is to quit smoking.
→ Source: Lally et al., 2010, Singh et al., 2024
→ Read more: Learning Habits
29. Task switching does not create a 40% productivity tax
This number traces to an explainer page reporting that a researcher “has said” switching can cost as much as 40% of productive time. No study is cited. The 2001 paper it usually gets attached to measured switching costs in fractions of a second.
→ Source: American Psychological Association, Wiradhany & Nieuwenstein, 2017
→ Read more: The Multitasking Myth
30. One-to-one tutoring does not improve learning by two standard deviations
Bloom’s 1984 figure came from two experiments run by his own doctoral students, and it combined two interventions rather than one: tutoring plus mastery learning. Tested at scale across 96 controlled trials, modern tutoring comes in at 0.37, which moves the average learner up about 14 percentile points. Not bad, but not two standard deviations.
→ Source: Bloom, 1984, Nickow, Oreopoulos & Quan, 2020
→ Read more: The 2 Sigma Problem
Final Words
Thirty numbers that establish a clear pattern.
The figures that held up mostly describe things that feel worse to do: testing instead of reviewing, spacing instead of blocking, and being told what you got wrong.
The ones that collapsed mostly describe things that feel like progress: the decorative image, the enjoyable session, and the confident self-assessment.
But ease, familiarity, and enjoyment are not the same thing as learning, and designing for the first three is how a healthy budget buys a weak outcome. The answer, of course, is to design for how our brains are wired.
So, when the next number lands on your desk, ask yourself these questions:
- Who measured it, and on whom?
- What did they actually measure, and is it the thing you care about?
- Has anyone outside the lab found it too?
Most numbers will not survive that. Build your next programme on the ones that do.
Design from evidence, not instinct
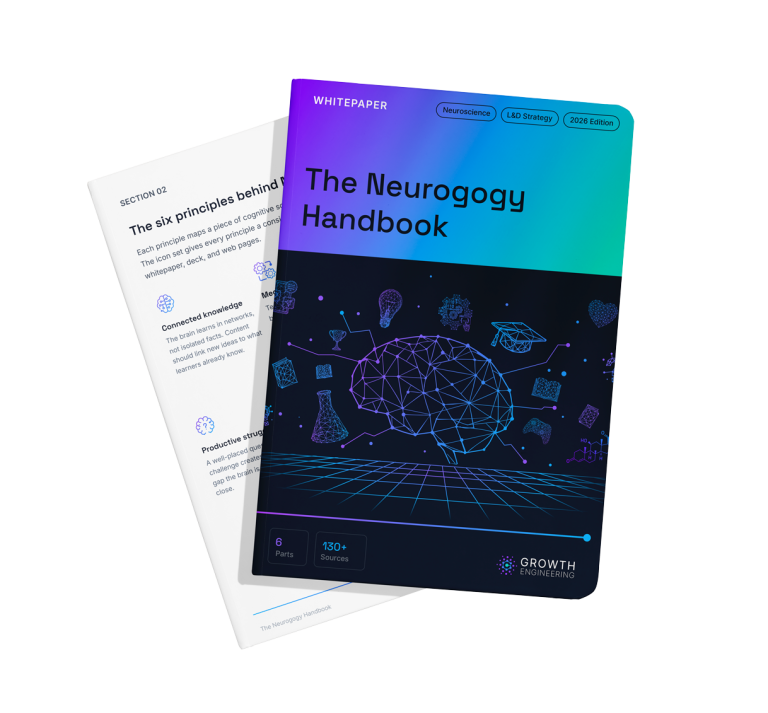
This is thirty numbers. The Neurogogy Handbook has all 130+, organised into six parts, including: how the brain takes information in, what makes it stay there, what reaches the job, and which line items to stop funding.
- Read the handbook, in your browser or as a PDF
- Book a demo to see how the Impact Suite puts this evidence into practice
- Explore the Impact Suite and the neuroscience behind every feature