In today’s digital landscape, learning platforms have become a cornerstone for delivering online training programmes. But providing great content is only half the story. After all, without effective reporting, you’ll never unlock the true power of your learning data.
One of the most significant advantages of moving your training programme online is the wealth of data and insights you gain access to. Your reporting tools transform your LMS into a goldmine of information about learner behaviour and performance.
Reporting and data analysis might seem like yet another hurdle in your workflow, but for L&D professionals, it’s a game-changer. After all, mastering your learning platform’s reporting features empowers you to make better informed decisions and prove your value.
And as only 8% of CEOs say they see any business impact from their training programmes, it’s clear that something has to be done. As Peter Sondergaard puts it, ‘Information is the oil of the 21st century, and analytics is the combustion engine.’
This article delves deep into the world of LMS reporting, guiding you through the process, the types of reports you can run, how to make data-driven decisions, and ultimately, how to achieve a greater return on investment (ROI) for your training programmes.
Ready? Let’s dig into the data!
What is Reporting?
Unless learner engagement is an issue, your learning management system (LMS) will be a hive of activity. Logins, discussions, interactions — it’s a learning frenzy. But, all these data points can be overwhelming. How can you make sense of it all?
Reporting on your learning platform is the process of gathering, analysing, and presenting the data generated by your learners as they interact with your environment. This data provides you with insights that enable you to optimise the learning experience you provide.
Here’s a breakdown of what reporting on an LMS typically entails:
- Data Collection: Your LMS tracks user activity, including logins, course progress, assessment results, time spent on modules and completion rates.
- Analysis: This data is then analysed to identify trends and patterns. This involves calculations, comparisons and filtering information based on specific criteria.
- Reporting: The analysed data is then presented in an easy to understand format. This is usually delivered through charts, graphs and tables.
Why is Reporting Important?

According to Research.com, 82% of learning professionals say that reporting and analytics features are important in an LMS platform. We think this number should be even higher.
Reporting plays a vital role in the success of any structured workplace training initiative. Without it you’re left in the dark with no flashlight. And when it comes to organisational learning, flying blind doesn’t offer much promise.
Thankfully, by leveraging your learning platform’s reports, you can:
- Track learner progress: Keep tabs on individual and group progress through your learning materials and identify individuals who may require additional support.
- Evaluate effectiveness: See how well your learning materials are performing based on course completion rates, assessment scores and learner feedback.
- Measure training ROI: Assess the return on investment against your training spend by analysing your costs and the impact on learner performance.
- Identify improvements: Gain insights into which parts of your training programme are working well and where adjustments might be needed.
- Personalise your learning: Use reporting data to personalise your learning experiences based on individual needs and preferences.
With organisational L&D, you simply can’t afford to rely on guesswork. LMS reporting empowers data-driven decision making, leading to more effective training programmes and improved learning outcomes. Knowledge really is power.
Setting Goals and Objectives
Before diving into the expansive data ocean within your learning platforms, it’s important to start with a destination in mind. Here, your goals and objectives act as your compass, guiding you to extract the most valuable insights from your reports.
Not sure where to start? Here are Growth Engineering’s top goal-setting tips.
- Align with Business Needs: Don’t get lost in the weeds. Align your learning goals with your organisation’s broader business objectives. Is boosting customer satisfaction, minimising risk or improving sales numbers top of your training agenda? Understanding the bigger picture is key to identifying the right data to track.
- Focus on SMART Goals: Vague or wishy-washy goals will get you nowhere. They’ll also be difficult to track. Make sure your goals are SMART (Specific, Measurable, Achievable, Relevant and Time-bound). Here’s an example: increase course-completion rates by 15% within the next quarter.
- Break Down Objectives: Don’t forget, each goal can be broken down into smaller, more specific objectives. Again, this helps you identify the data points that really matter. For instance, if you’re seeking to increase course-completion rates, then a sub-goal could be to break your current content down into bite-size chunks.
- Consider Your Audience: Finally, take your learners’ needs into account. Understanding their preferences and challenges will help you set relevant goals. For example, if you’re looking to raise course completion rates, you should survey your learners to help identify engagement issues.
Well-defined goals and objectives are the key to unlocking the true power of your learning data. Next up, we’ll explore how you can access the information you need through your learning platform’s reporting tools.
Key Metrics & Reports
Your learning platform is a treasure trove of data. But with such bountiful plunder available, where do you begin? Let’s delve into the key reports that help you to understand learner engagement and training programme effectiveness.
User Activity Reports
- Logins and Activity: Track your platform’s usage by monitoring login frequency and user activity levels. This will give you a high-level view of learner engagement.
- Course Progress: Monitor individual and group progress through your training courses. Identify learners who are struggling or courses that aren’t engaging.
- Content Completion: Establish completion rates for your training modules, assessments, and other learning materials.
- Content Interactions: Analyse how your learners interact with your content. Do they utilise all the resources offered, including videos and downloadable materials?
- Time Spent: Track the average time spent on your learning platform and on individual training assets. Are your learners rushing through your content?
- SCORM Reports: If your LMS uses SCORM (Sharable Content Object Reference Model) for eLearning content, you can access granular data on learner progress.
Assessment Reports
- Assessment Scores: Review assessment, test and quiz scores to gauge knowledge retention and establish areas where learners may require further support.
- Question Data: Go beyond the score and analyse your assessments at a question level. This will help you to pinpoint precisely where your learners are struggling.

Administrative Reports
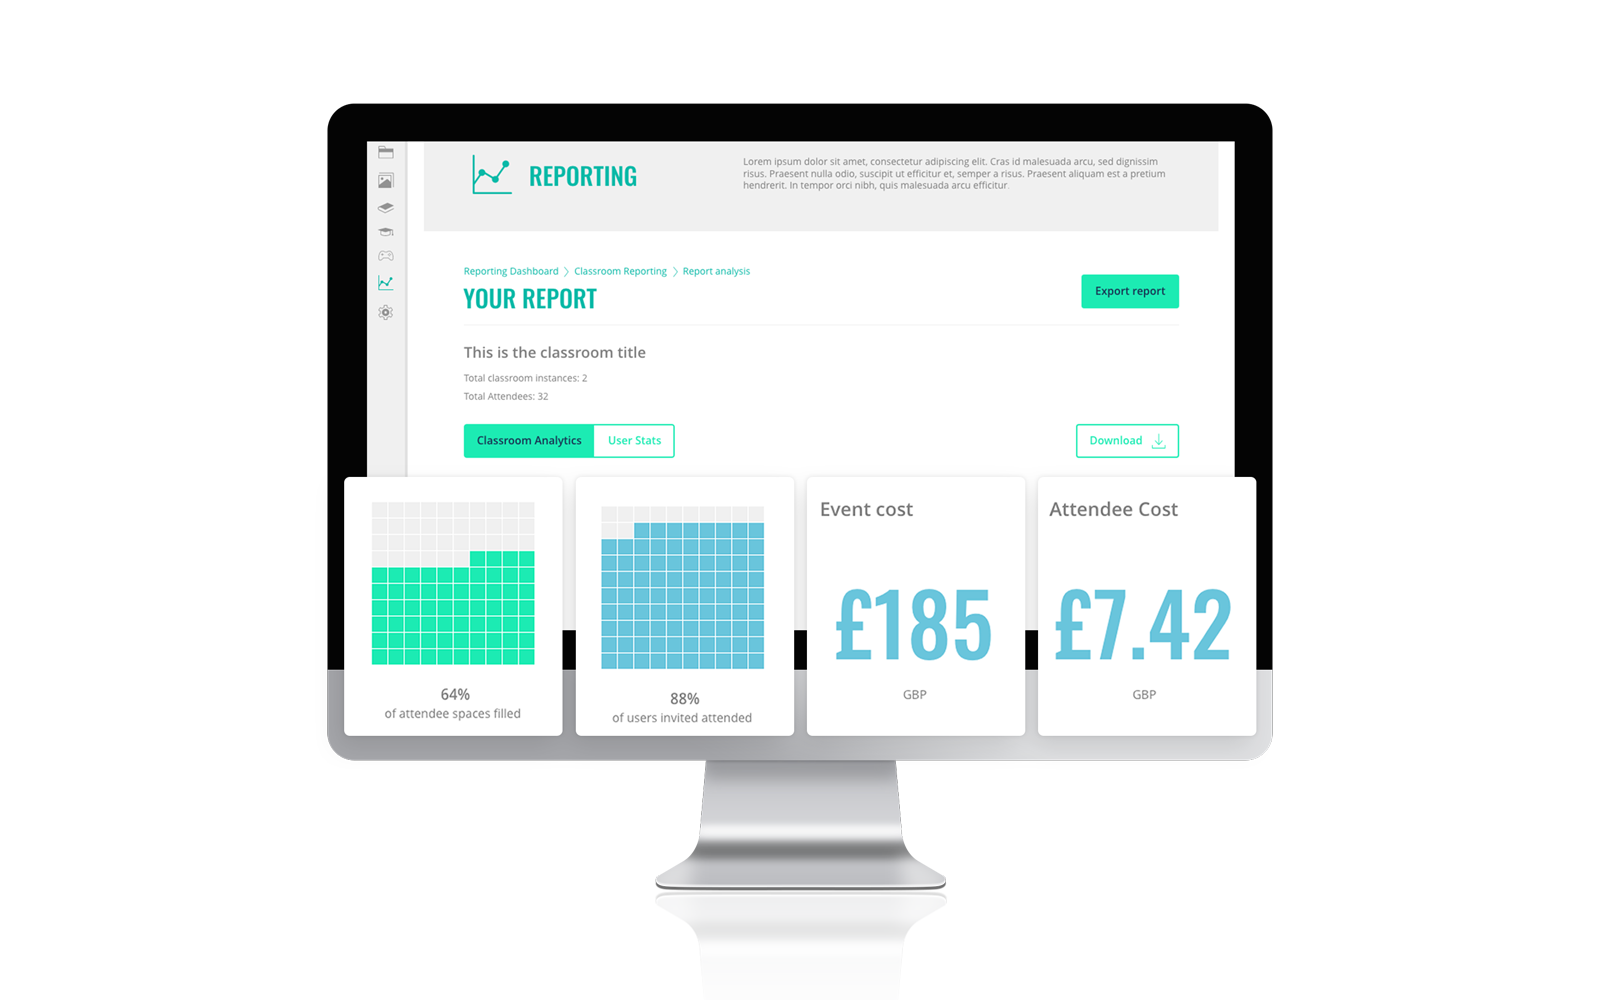
- Event Reports: Analyse attendance records for both classroom and digital events, alongside resource usage and cost summaries.
- Assessor Reports: Review marking progress for your qualitative assessments to ensure they are completed and scored in a timely manner.
- Certification Tracking: If your learning platform offers certifications, leverage its reporting capabilities to track learner progress and compliance rates.
- Feedback Surveys: Monitor survey responses and feedback forms to gauge learner sentiment and identify areas for improvement.
- Search Query Reports: Analyse the search terms learners use within your learning platform to unearth knowledge or information gaps.
- Skills Reports: Leverage your learning platform to report on data associated with learner profiles, including skills, experience, qualifications and interests.
Gamification & Social Reports
- Social Activity: Dive into learner activity across your social streams and discussion forums. Analyse new posts, replies, and likes and identify trending topics.
- Badges, XP, Levels: Review your gamification data to see what badges and experience points your learners have earned and what their current level is.
- Contests: Identify subject matter experts by analysing performance data from your learner-vs-learner and team-vs-team quiz showdowns.
Creating Custom Reports
Ready to break the mould? Many learning platforms offer the ability to go beyond reporting presets to create your own custom reports. This empowers you to tailor your data analysis to your specific needs and learning goals. Here’s how this works:
- Set the Parameters: You define the parameters of your custom reports. This means you can select specific data points, learner groups, courses, timeframes and so on.
- Focus, Focus, Focus: Custom reports help you to align your reporting with your goals. For example, you could configure a custom report that helps you understand completion rates for a specific department.
- Deeper Insights: Pre-defined reports can leave you wading through a sea of data. On the other hand, customised reports allow you to drill down and uncover the specific insights that matter most to your training programme.
As we’ve seen, learning management systems typically track core data like course completions and scores. But you can go deeper. With Growth Engineering LMS, you can even add custom fields to your learning dataset.
This empowers you to capture additional information specific to your training needs, such as learner demographics, employee IDs, project assignments and so on. Once you’ve populated these custom fields with data, you can then leverage them in your reports.
Ultimately, your custom reports grant you a more nuanced understanding of learner behaviour and programme effectiveness. You can then use these insights to improve your overall approach.
Scheduling, Sharing and Exporting Reports
Your LMS reports hold valuable insights, but what good is all this knowledge if it’s locked away? Thankfully, most reporting suites empower you to schedule and share your learning data automatically.
Once you’ve set up a custom report, you can then schedule it to run automatically at regular intervals (daily, weekly, monthly, etc.). This ensures you have fresh data readily available to inform your decision-making.
With Growth Engineering LMS, you can also automate who receives your scheduled reports (in a CSV or Excel format). This helps you to keep your stakeholders informed and ensures that sensitive data is only viewed by authorised personnel.
By exporting your learning data, you’ll be able to perform further analysis within software like Excel. You’ll also be able to forward it on to other viewers. Just remember, context is key. Always provide a brief explanation of your report’s purpose and key findings.
Using Google Analytics Data
As your learning platform is an online solution, Google Analytics is a powerful companion. By leveraging the supplementary data it provides, you can gain valuable insights into your learners’ interactions with your training programmes. For instance:
- Demographics: If you haven’t already captured learner demographics within your LMS, Google Analytics is a game-changer. It provides useful information like age, location and gender, so you can tailor your content accordingly.
- Devices: Google Analytics can also reveal the devices your learners are using to access training materials. If you discover that the majority are using mobiles, then it might be time to embrace a microlearning strategy.
- Interests: Google Analytics unlocks a treasure trove of user behaviour data. By using this data, along with your existing LMS reports, you’ll be able to see which areas of your platform are generating the best levels of engagement.
- Pre and Post Training Activity: With Google Analytics, you’ll be able to see how learners arrive at your learning platform (the source) and where they go once they’re finished. Are you successfully driving them towards further resources?
Setting up Google Analytics within your learning platform is a breeze. You’ll need to create a Google Analytics property and pass the tracking code over to your platform provider. They’ll integrate the code into your system ensuring optimal data flow.
Data Visualisation
With hundreds or potentially thousands of learners actively engaged, your LMS will generate a massive dataset. Data visualisation plays a crucial role in transforming this raw learning data into understandable insights.
This is the process of taking data and transforming it into visual representations like charts, graphs, maps and infographics. This makes it easier to identify patterns, trends and anomalies that you might otherwise have missed.
Many learning platforms offer built-in visualisation tools, making it easy to get started. For more advanced needs, you can integrate with popular solutions like Power BI, Tableau, Looker or Snowflake’s Snowsight. Either way, you’ll unlock the following benefits:
- Simplification: It’s difficult to make sense of data unless it’s presented in the right way. Charts, graphs and other visualisations help to illuminate patterns and trends that might otherwise remain hidden.
- Engagement: Numbers can be technical and dry, but visuals tell a clear and compelling story. This makes your learning data engaging and accessible to a wider audience, even those without extensive data expertise.
- Insights: By visualising your data, you can swiftly identify areas of your programme that require closer attention. This gives you all the information you need to make quick and informed decisions.
Turn Reports Into Actionable Insights
Now you’ve used your reporting suite to collect and visualise your data, it’s time to put it to work. According to PwC research, data-driven organisations are 3x more likely to report significant improvements in decision-making. Here are some helpful pointers:
- Start Simple: Focus on the ‘So what?’. Don’t get bogged down in every data point. Look for the big picture trends, patterns or outliers that stand out. Ask yourself what this information means for you and your training programme.
- Prioritise Properly: Remember, not all findings are equally important. Identify the insights that have the highest potential impact on improving your training programmes. If helpful, consider using an Eisenhower Matrix.
- Seek Solutions: Once you’ve reviewed the data and prioritised your next steps, brainstorm potential strategies to improve your programme. For example, if you identify a training unit with a low completion rate, how can you enhance it?
- Assign Actions: Next, you’ll need to turn your chosen strategies into actionable steps. Take care to assign an owner for each action, establish a timeline and make necessary resources available to your team.
- Performance Progress: Establish clear metrics to track the progress of your action steps and the overall impact this has on your training programme. Measure the results against your initial goals to show how far you’ve come.
As you know, learning and development is an ongoing and iterative process. You’ll need to use your data and feedback to refine your strategies and reports over time. Need more support? You’re in luck — we’ve got a full article on data-driven decision-making.
And don’t forget, if you’re collecting and storing learner data, you’ll need to do so responsibly. Ensure you follow all relevant data protection regulations and implement robust security measures to safeguard any sensitive learner information.
Final Word
Effective training goes beyond simply delivering content. It requires creating engaging learning experiences that deliver measurable outcomes. With this in mind, you can’t afford to let your data go untapped.
Your learning platform’s reporting tools are a goldmine of valuable data, offering insights into learner behaviour and programme effectiveness. By leveraging these tools you can uncover hidden trends and patterns that can significantly improve your training initiatives.
With a vast array of reporting options, custom reports, and data visualisation tools at your fingertips, you can now get a deep and holistic understanding of your training programme. This kind of 360° view means you’re more empowered than ever before.
The power of data is in your hands. Don’t let it go to waste!
Thanks for reading. Effective data analysis is a powerful tool for any L&D professional. But it’s only part of the picture. Dive deeper with our comprehensive resource, The L&D Professional’s Handbook. Download your free copy now!